
ABOUT ME
» TECHNICAL KNOWLEDGE «
Data Collection
- Data Acquisition: Web scraping (BeautifulSoup, Selenium), API integration, Survey design
- ETL Processes: Design, automation and implementation
- Data Storage & Management:
- Relational Databases (MySQL, PostgreSQL): Schema design, data normalization/denormalization, partitioning and indexing
- Data Wrangling:
- Cleaning, transformation, handling missing values (imputation, removal), outlier detection, data integration and aggregation (combining data from different sources into a unified dataset)
- Tools: Pandas and NumPy (SciPy)
Statistical Analysis & Modeling
- Statistical Methods:
- Hypothesis testing, descriptive/ inferential statistics, probability theory, Bayesian statistics
- Machine Learning:
- Supervised Learning: Regression, classification (neural networks)
- Unsupervised Learning: Clustering, dimensionality reduction
- Model Development:
- Feature engineering, model evaluation (cross-validation, A/B testing), model selection/optimization
- Tools: Python (Scikit-learn, Statsmodels, TensorFlow/Keras)
Data Visualization & Communication
- Data Visualization:
- Dashboards, reports
- Tools: Tableau, Looker Studio, Python (Matplotlib, Seaborn, Plotly), Excel
- Cloud Platform Familiarity
- Microsoft Azure (most used platform, working towards certification), AWS (certified), Google Cloud
- ETL/ELT Pipeline Design and Management
- Automating and implementing ETL/ELT processes using tools like Azure Data Factory, AWS Glue, and dbt (data build tool)
- Designing and implementing efficient ETL and ELT processes
- Building and maintaining data pipelines
- Utilizing tools like Apache Spark and Hadoop for large-scale data processing
- Data Storage and Management
- Experience with data lake platforms including Azure Data Lake Storage and Amazon S3
- Knowledge of data warehousing solutions like Azure Synapse Analytics, Amazon Redshift, and BigQuery
- Familiarity with SQL (MySQL, PostgreSQL) and NoSQL (MongoDB) databases
- Data Integration and Interoperability
- Integrating various data sources through RESTful APIs or GraphQL
- Knowledge of different data formats (CSV, JSON, Parquet, etc) and their appropriate use cases
- Data Warehousing and Business Intelligence
- Azure Synapse Analytics, Amazon Redshift, Google BigQuery
- SQL Querying and Optimization
- Advanced SQL querying, SQL optimization techniques, window functions, CTEs (Common Table Expressions)
- Database Design and Schema Development
- ER modeling, normalization, dimensional modeling, star and snowflake schemas
- Performance Tuning and Indexing
- Query profiling and optimization, indexing strategies, partitioning, sharding
- Data Security and Compliance
- Familiarity with implementing security best practices, data encryption, and access controls via role-based access control (RBAC) and IAM (Identity and Access Management)
- Knowledge of regulatory requirements like GDPR, CCPA, HIPAA, and ensuring data practices are compliant
- Containerization and Orchestration
- Docker, Kubernetes
- Machine Learning Integration
- MLFlow, TensorFlow, PyTorch
- Version Control
- Git, Github
- Development Practices
- CI/CD, DevOps principles, automated testing
- Python
- Pandas, NumPy, SciPy, Scikit-learn, Statsmodels, Plotly, Matplotlib, Seaborn, BeautifulSoup, Selenium
- SQL
- DDL and DML
- Familiarity with RDBMS (MySQL, PostgreSQL)
- HTML, CSS, JavaScript
- Bootstrap, jQuery, React, Node.js
Also familiar with PHP, Java, C#, and C++ and most CMS platforms, including WordPress, Shopify, BigCommerce, SquareSpace, Joomla, and Drupal
- Python Libraries
- Matplotlib, Seaborn, Plotly
- Data Visualization Tools
- Looker Studio (Google Data Studio)
- Tableau
- Power BI
- Google Analytics (GA4, UA)
- Google Tag Manager (GTM)
- Google Search Console
- SEMRush
- Google PageSpeed Insights
- GTMetrix
- Screaming Frog
- Hotjar
- Ahrefs
- Google Keyword Planner
- Google Ads
- Search, Display, Video, Shopping, Performance Max, App
- Organic & Paid Social
- Facebook, Instagram, Snapchat, TikTok, LinkedIn
- Streaming
- YouTube, Hulu
- MailChimp
- Salesforce
- HubSpot
- Microsoft Suite
- Excel (VLOOKUP, Pivot Tables, Conditional Formatting), PowerPoint, Word, Outlook, Access
- Google Suite
- Sheets, Slides, Docs, Drive
» EDUCATION «
- Masters of Science in Data Analytics, Western Governors University, August 2025
- Bachelor of Science in Computer Science, Western Governors University, June 2023
- Bachelor of Arts in Anthropology, University of Montana, May 2015
- WGU Certificate: Data Preparation, Credential ID: 65e273590d88f060be6a8cd4
- AWS Certified Cloud Practitioner, Credential ID: Q5W20LCK0FF1Q55G
- ITIL 4 – IT Service Management, Credential ID: GR671475483HB
- Google Analytics Certified, Credential ID: 144781538
- Google Ads – Display Certification, Credential ID: 144288927
- Google Ads – Measurement Certification, Credential ID: 144269381
- Google Ads – Search Certification, Credential ID: 38886503
- Google Ads – Video Certification, Credential ID: 81038461
» INDUSTRY FAMILIARITY «
Below is a selection of industries and organizations I’ve worked with, highlighting my ability to work with diverse business types.
- A-Abel Family of Companies – HVAC, Electric, Plumbing
- Go2Pros Pest Control
- KBD (Kitchens by Design)
- General Tree Company
- Huber Management Corp.
- Solar Shade Truck & Car Paradise
- Solid Rock Roofing
- Denise Swick & Co. Real Estate
- PRG (Premier Resources Group) Team – Construction Staffing
- CURT (Construction Users Roundtable) – Construction
- Retrofix Games
- Cincy T-Shirt Co.
- Brock’s Performance
- The Shopping Bag
- Karma Kollective
- Jaffe Jewelers
- Bloombeads
- BHA Piano
- Smedleys Chevrolet
- Beau Townsend Ford
- Beau Townsend Nissan
- Ride 1 Powersports
- Dyer, Mann, Garofalo, & Schultz L.P.A.
- The Clardy Law Firm
- Weaver Law
- Franklin D Azar & Associates
- McGarity Law Firm
- Poelking Wellness (Chiropractic Care & Physical Therapy)
- Pot Card Online (Online MMJ Provider)
- Dr. Richard W. Teeters (Chiropractic Care)
- Dr. Thomas C. Volck (Dental)
- Fountain of Youth (Med Spa)
- YMCA of Greater Dayton
- NCCJ of Greater Dayton
- For Love Of Children (FLOC)
- Stop Bullying Dayton
- Christmas for Kids
- Safe Birth Project
Judicial
- Magistrate G. Parker for Judge*
- Mary Montgomery for Judge*
- Marshall Lachman for Judge
- Solle for Judge*
- Arvin Miller for Judge
- Tony Schoen for Judge
- Julie Bruns for Judge*
City Government
- Woods for Vandalia City Council
- Sinclair Community College
- Chaminade Julienne High School
- Cousin Vinny’s Pizza (all locations)
- Tessora Liqueurs
» OUTSIDE OF MY CAREER «
When I’m not hunkered down behind a computer screen, I enjoy being out in nature – hiking throughout Ohio and my home state of Montana with my fiancé and our corgi, foraging for huckleberries & paw paw fruit, kayaking, hunting, fishing, and gardening (or, at least, attempting to make things grow).
Indoors, I enjoy painting landscapes and abstract portraits with acrylics & watercolors, baking, binge watching fantasy & sci-fi shows and movies, and hosting board game/D&D nights and painting parties with my friends.
I also have a unique passion for entomology that stems from my educational background in forensic anthropology – I enjoy ethically collecting, pinning, and preserving butterfly, moth & other insect specimens. If we ever chat over video, you might see a gallery of some of my collection in the background!







DATA ANALYTICS PROJECTS
During my Master of Science in Data Analytics program, I gained comprehensive experience in the data analytics lifecycle by working on a diverse range of projects. These projects encompassed each critical stage, from identifying and defining the business problem to drawing actionable insights and evaluating the results.
Data Quality Assessment & Remediation - Hospital Patient Records
Before any analysis could be trusted, this 10,000-patient, 52-variable hospital dataset needed a full audit. I profiled every field against the organization’s data dictionary, documented what was wrong and why it mattered, and designed a remediation plan that balanced data completeness against the risk of introducing false information.
- Built a two-level profiling approach: a dataset-wide scan for structure, counts, and types, followed by a column-by-column review for duplicates, nulls, cardinality, and value ranges
- Uncovered schema problems that would have silently skewed analysis, including charge fields labeled as totals that actually stored daily averages, a “State” field containing non-state regions, and 26 time zone values where only 7 US time zones exist
- Chose field-specific handling for missing values based on business meaning, leaving sensitive health indicators blank rather than imputing them so gaps stayed visible for follow-up
- Proposed standardized naming conventions and clearer field definitions, including renaming ambiguous demographic fields to reflect that they may describe the insurance policyholder rather than the patient
- Applied Principal Component Analysis to the cleaned quantitative variables and retained six components using eigenvalue and scree plot criteria
Competitive Churn Analysis - PostgreSQL Data Integration & Tableau Dashboard
This project rebuilt a competitive churn analysis entirely inside a relational database. I loaded a public competitor dataset alongside an internal customer database, reconciled the two schemas in SQL, and fed a single consolidated table into an interactive Tableau dashboard.
- Created a new PostgreSQL table for the external dataset and imported it from CSV, then wrote SQL transformations to map text categories (contract type, payment method) to the internal database’s reference IDs
- Harmonized field definitions across sources, converting ages to a senior citizen flag, child counts to a dependents indicator, and marital status to a partnership flag so both datasets measured the same things
- Tagged every record with its data source before merging with UNION ALL, preserving lineage so any metric could be traced back to its origin
- Deliberately kept the external table out of the database’s foreign-key relationships because its records could not be verified against internal keys, and documented that decision as a known limitation
- Explained how existing foreign-key constraints enforced referential integrity across the contract, payment, job, and location tables
Credit Card Customer Segmentation with Unsupervised Learning
For my master’s capstone, I tested whether 8,950 credit card holders could be grouped into distinct behavioral profiles from six months of transaction data. I set a formal, measurable success threshold before modeling and reported the results against it, even when the model fell short.
- Framed the research as a hypothesis test with a silhouette score threshold of 0.5 defining “well-separated” customer segments
- Handled missing values with logic tied to customer behavior, setting minimum payments to zero for inactive accounts and using medians elsewhere to preserve each feature’s distribution
- Selected three clusters using the elbow method and silhouette analysis, then used PCA to reduce 18 features to two dimensions for visual validation
- Profiled three segments (engaged high spenders, low-engagement cautious users, and cash-advance-reliant revolvers) and translated each into a targeted strategy
- Reported a silhouette score of 0.25, failed to reject the null hypothesis, and documented why K-Means assumptions likely limited separation, recommending DBSCAN and Gaussian mixture models as next steps
Tools & Technologies Used:
Python, pandas, scikit-learn (K-Means, PCA), Matplotlib, Seaborn
Hospital Revenue Forecasting with SARIMA
Using two years of daily hospital revenue, I built a forecasting model to answer a practical planning question: what will revenue look like over the next 120 days, and how confident can we be?
- Converted an unlabeled day index into a proper datetime series and verified complete daily coverage with no gaps across 731 observations
- Investigated negative revenue values as possible data errors and confirmed them as legitimate loss days instead of removing them
- Diagnosed non-stationarity with an Augmented Dickey-Fuller test and identified weekly seasonality (Wednesday peaks, Friday dips) through decomposition, ACF/PACF plots, and spectral density analysis
- Moved from a standard ARIMA model, which produced a flat forecast, to a seasonal SARIMA model with a 7-day period
- Evaluated the forecast against a 120-day holdout with an MAE of $2.05M and RMSE of $2.46M, with most actual values inside the 95% confidence interval
Tools & Technologies Used:
Python, pandas, statsmodels, scikit-learn, Matplotlib
Diabetes Classification - Model Evaluation Beyond Accuracy
This project continued a series of diabetes prediction models (logistic regression and k-nearest neighbors) by testing a decision tree. Its real value is in the evaluation: showing how a respectable-looking accuracy score can hide a model that fails at its core job.
- Used stratified train/test splitting to preserve the dataset’s roughly 27% diabetic rate across both sets
- Evaluated the model with a confusion matrix, precision, recall, and MSE rather than relying on accuracy alone
- Showed that 59% overall accuracy masked only 26% recall for diabetic patients, meaning the model missed nearly three of every four actual cases
- Connected the pattern to class imbalance seen across all three models in the series and recommended resampling, class weighting, F1 scores, and precision-recall curves
Tools & Technologies Used:
Python, pandas, scikit-learn (DecisionTreeClassifier), Matplotlib, Seaborn
Sentiment Classification with a Bidirectional LSTM
I trained a neural network to classify customer reviews as positive or negative, combining labeled review data from Amazon, Yelp, and IMDb to test whether sentiment patterns generalize across domains.
- Profiled raw text before modeling, identifying 2,748 emojis and several non-ASCII characters, and normalized the text with regular expressions
- Set a maximum sequence length statistically (mean plus two standard deviations) rather than padding to the longest review, reducing unnecessary padding
- Tested a heuristic 9-dimension embedding, found it underperformed, and switched to frozen 100-dimension pretrained GloVe embeddings
- Built a bidirectional LSTM with dropout and early stopping, reaching about 80% test accuracy with closely aligned training and validation performance
Tools & Technologies Used:
Python, TensorFlow/Keras, GloVe embeddings, scikit-learn, pandas
Executive Churn Dashboard & Data Storytelling
An interactive Tableau story built for a non-technical executive audience, comparing internal churn data (9,769 customers) with a public competitor dataset (7,043 customers).
- Prepared and aligned both datasets in Python, remapping mismatched fields so the two companies could be compared side by side
- Created calculated churn rate and customer lifetime value metrics, finding nearly identical churn (26.50% vs. 26.54%) but a two-year-contract CLV nearly double the competitor’s ($6,146 vs. $3,707)
- Designed filters for dataset, contract type, and tenure so leaders could explore the segments relevant to their own areas
- Built for accessibility with colorblind-safe and grayscale palettes, direct labels, and detailed tooltips
Length-of-Stay Drivers with Multiple Linear Regression
A regression analysis identifying which patient characteristics and comorbidities most influence how long patients stay in the hospital.
- Wrote reusable Python functions to automate feature selection, iteratively removing variables above a VIF threshold of 5 and then eliminating predictors with p-values above 0.05
- Compared the initial and reduced models using AIC and BIC, confirming a simpler model with better fit
- Identified admission type, complication risk, diabetes, back pain, high blood pressure, stroke history, and daily charges as key factors
- Documented assumptions and limitations, including multicollinearity, outlier sensitivity, and the difference between correlation and causation
Diabetes Risk Factors with Logistic Regression
A logistic regression analysis examining which patient characteristics are associated with a diabetes diagnosis, with careful attention to model diagnostics.
- Applied the same automated VIF and backward elimination workflow, and documented the decision to keep one high-VIF variable after testing showed removing it hurt performance
- Calculated AIC and a likelihood ratio test by hand from model output, since the logit summary did not report them, and confirmed the reduced model fit as well as the full model
- Built a confusion matrix on an 80/20 split and showed that 71.8% accuracy came from a model predicting no diabetes cases at all
- Recommended rebalancing techniques and imbalance-appropriate metrics as next steps
Co-Prescription Pattern Mining with Association Rules
Applying market basket analysis to hospital prescription data to uncover medications frequently prescribed together and what they might suggest about patient comorbidities.
- Caught an import artifact where every other row was blank and removed those rows before analysis
- Restructured patient prescription columns into transaction lists and one-hot encoded them for the Apriori algorithm
- Tested support thresholds from 0.01 to 0.2 and chose 0.05 to balance meaningful patterns against noise, with a minimum lift of 1.1
- Surfaced cardiovascular and psychiatric co-prescription pairings (lift up to about 1.44) and recommended joining results with diagnostic data to validate the patterns clinically
Patient Segmentation with K-Means Clustering
A clustering analysis grouping hospital patients by health, utilization, and cost characteristics.
- Standardized continuous variables so each contributed equally to distance calculations
- Selected three clusters with the elbow method and ran K-Means with multiple centroid initializations for stability
- Measured cluster quality with a silhouette score of 0.22 and used a PCA projection to show one well-separated cluster and two heavily overlapping ones
- Summarized each cluster’s average profile to translate results into patient groups
Tools & Technologies Used:
Python, pandas, scikit-learn (K-Means, PCA), Matplotlib, Seaborn
Dimensionality Reduction with Principal Component Analysis (PCA)
Using PCA to find the underlying dimensions that summarize patient characteristics and hospital utilization.
- Standardized ten continuous variables covering demographics, health indicators, and utilization
- Selected two principal components using a scree plot, together explaining 40.32% of total variance
- Interpreted PC1 (29.86%) as a hospital resource utilization and cost dimension, and PC2 (10.46%) as a patient health and nutrition dimension
Tools & Technologies Used:
Python, pandas, scikit-learn (PCA, StandardScaler), Matplotlib
Hypothesis Testing: Weight Status & Comorbidities
A statistical study testing whether patient weight status is associated with six common health conditions.
- Justified chi-square testing over t-tests and ANOVA based on the categorical nature of every variable involved
- Tested each association at α = 0.05, finding a statistically significant relationship only with high blood pressure
- Produced univariate and bivariate visualizations, including distributions, violin plots, and box plots
- Recommended more granular data collection (BMI categories and condition subtypes) to address limits of the binary “overweight” field
Relational Database Design & Customer Segment Query
A database project that extended an existing customer database with new service data and answered a business question with SQL.
- Designed a new table with a primary key, a foreign key to the customer table, and NOT NULL constraints to prevent orphaned or incomplete records
- Loaded CSV data into PostgreSQL and documented a one-to-one relationship across 10,000 records
- Wrote a query using LEFT JOINs, CASE-based aggregation, and divide-by-zero protection to calculate service adoption within a customer segment
Data Visualization
Dashboard & Report Examples
Examples of my ability to use visualization tools like Looker Studio and Tableau to create custom reports and dashboards for my clients. These reports focus on the client’s specific KPIs, providing them with actionable insights derived from Google Ads, Google Analytics (GA4), and social media ad campaigns.

Google Ads & Analytics Dashboard (Ads)
Platform: Looker Studio
Client: YMCA of Greater Dayton
Client Industry: Non-Profit (Fitness)

Google Ads & Analytics Dashboard (Analytics)
Platform: Looker Studio
Client: YMCA of Greater Dayton
Client Industry: Non-Profit (Fitness)
Comparative Analysis
Platform: Tableau
Client: WGU Telecommunications
Client Industry: Education
Facebook Ads Report
Platform: Canva, Ads Manager
Client: A-Abel Family of Companies
Client Industry: B2B Services
(HVAC, Plumbing, Electric)

Google Ads & Analytics Dashboard
Platform: Looker Studio
Client: Go2-Pros
(affiliated with Kitchens By Design)
Client Industry: B2C Services
(Pest Control & Extermination)

Google Ads & Analytics Dashboard
Platform: Looker Studio
Client: Kitchens By Design
(affiliated with Go2-Pros)
Client Industry: B2C Services
(Kitchen & Bath Renovation)

Google Analytics Monthly Traffic Report
Platform: Looker Studio
Client: A-Abel Family of Companies
Client Industry: B2C/B2B Services
(Electric, HVAC, Plumbing)
Consulting Report
Contains: Google & Social Ads Review and Professional Recommendations
Client: Sinclair Community College
Client Industry: Education
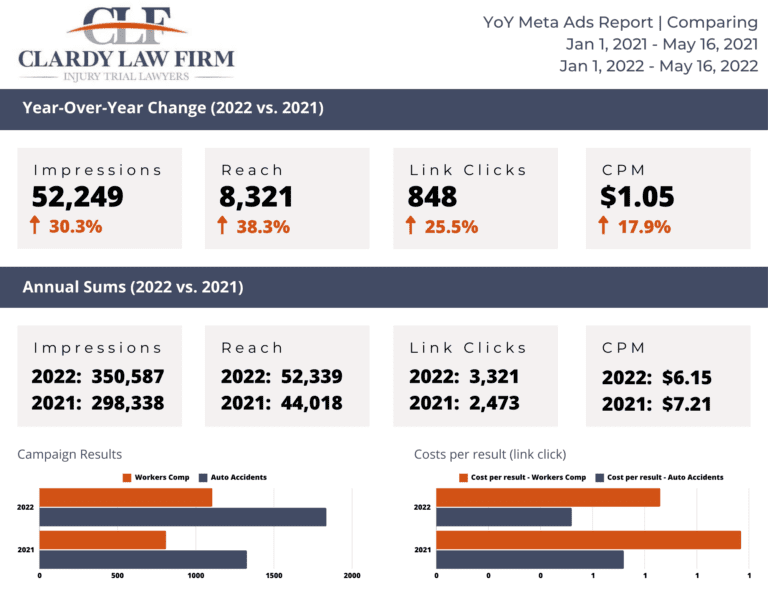
Facebook & Instagram (Meta) Ads Report
Platform: Looker Studio
Client: The Clardy Law Firm
Client Industry: Legal
Disclaimer: Due to client confidentiality, these examples may include anonymized or simulated data.
The visualizations are intended to showcase my analytical and visualization skills, not to represent specific client outcomes.
PROGRAMMING &
CODING PROJECTS
Building on my foundation in Computer Science, I continue to actively expand my programming skillset. While my day-to-day professional experience primarily involves using Python, SQL, HTML, CSS, and JavaScript, my education and self-teaching has equipped me with proficiency in Java and C++. Beyond that, I’ve explored other languages like C# and PHP for personal projects, building social media clones and 2D role-playing games. I’ve included this to demonstrate my ability to learn new languages and apply them to practical applications.
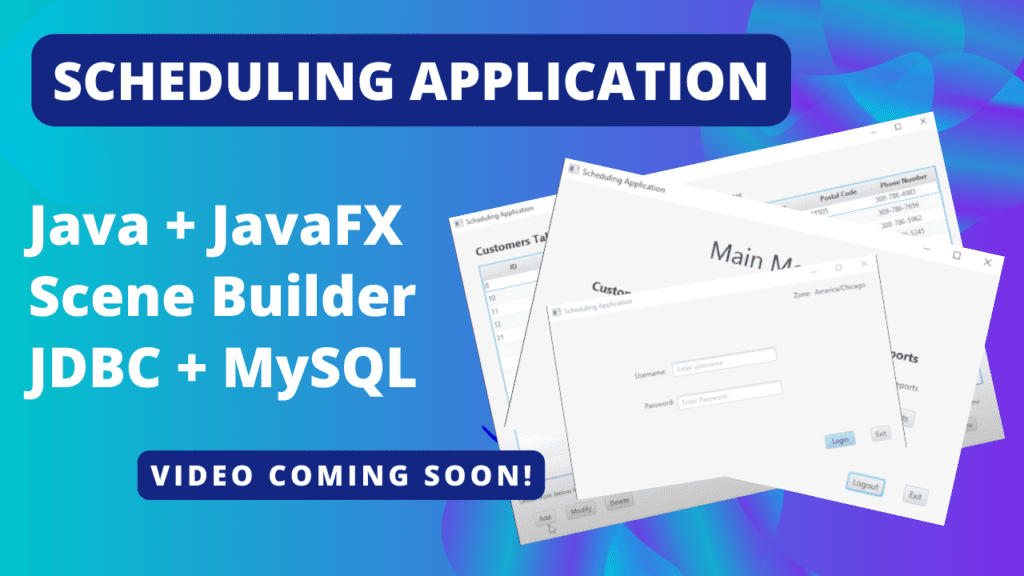
Scheduling Application
Designed and implemented a database, using MySQL (workbench) and SQL, for a scheduling application. The application was built primarily with Java, utilizing JDBC (a Java API) to allow the app to communicate with the database, to process SQL statements and execute queries. JavaFX Library and SceneBuilder were used to make a more aesthetically pleasing interface.
The database schema consists of basic tables that house data for appointments, contacts (company employees), customers, country information, first-level division information (depending on the country, division may mean state, province, territory, or region – which helps to determine which language to set the Login & Main Menu screens of the application to, as well as the time zones based on location), and users (database access [employee login] information).
The purpose of this application is to enable customers in different countries to schedule meetings with an American based company during the company’s hours of operation. Each table has its own functionality and purpose. The customer has the ability to schedule appointments with various contacts, assuming the appointment is within business hours and does not conflict with other appointments at that time.
Tools & Technologies Used:
JDBC with MySQL, SQL, Java (JDK 17), JavaFX Library, SceneBuilder
Inventory Management System
This inventory management system was built for a motorcycle parts company to store and keep track of parts and products inventory on local computers.
The application, written in Java with use of the JavaFX library and SceneBuilder for ease of creating the GUI, contains tables of in-house and outsourced parts and products, each of which can be added, modified, and removed.
A built-in option allows products to have associated parts (parts that require other parts and/or must be bought with a specific product), notifying users of association before deletion of either part or product.
The application also has simple search functionality, allowing users to search by Part or Product ID (auto-generated by the program) or complete or partial name of the part or product.
Tools & Technologies Used:
Java (JDK 17), JavaFX library, Scene Builder
Class Roster
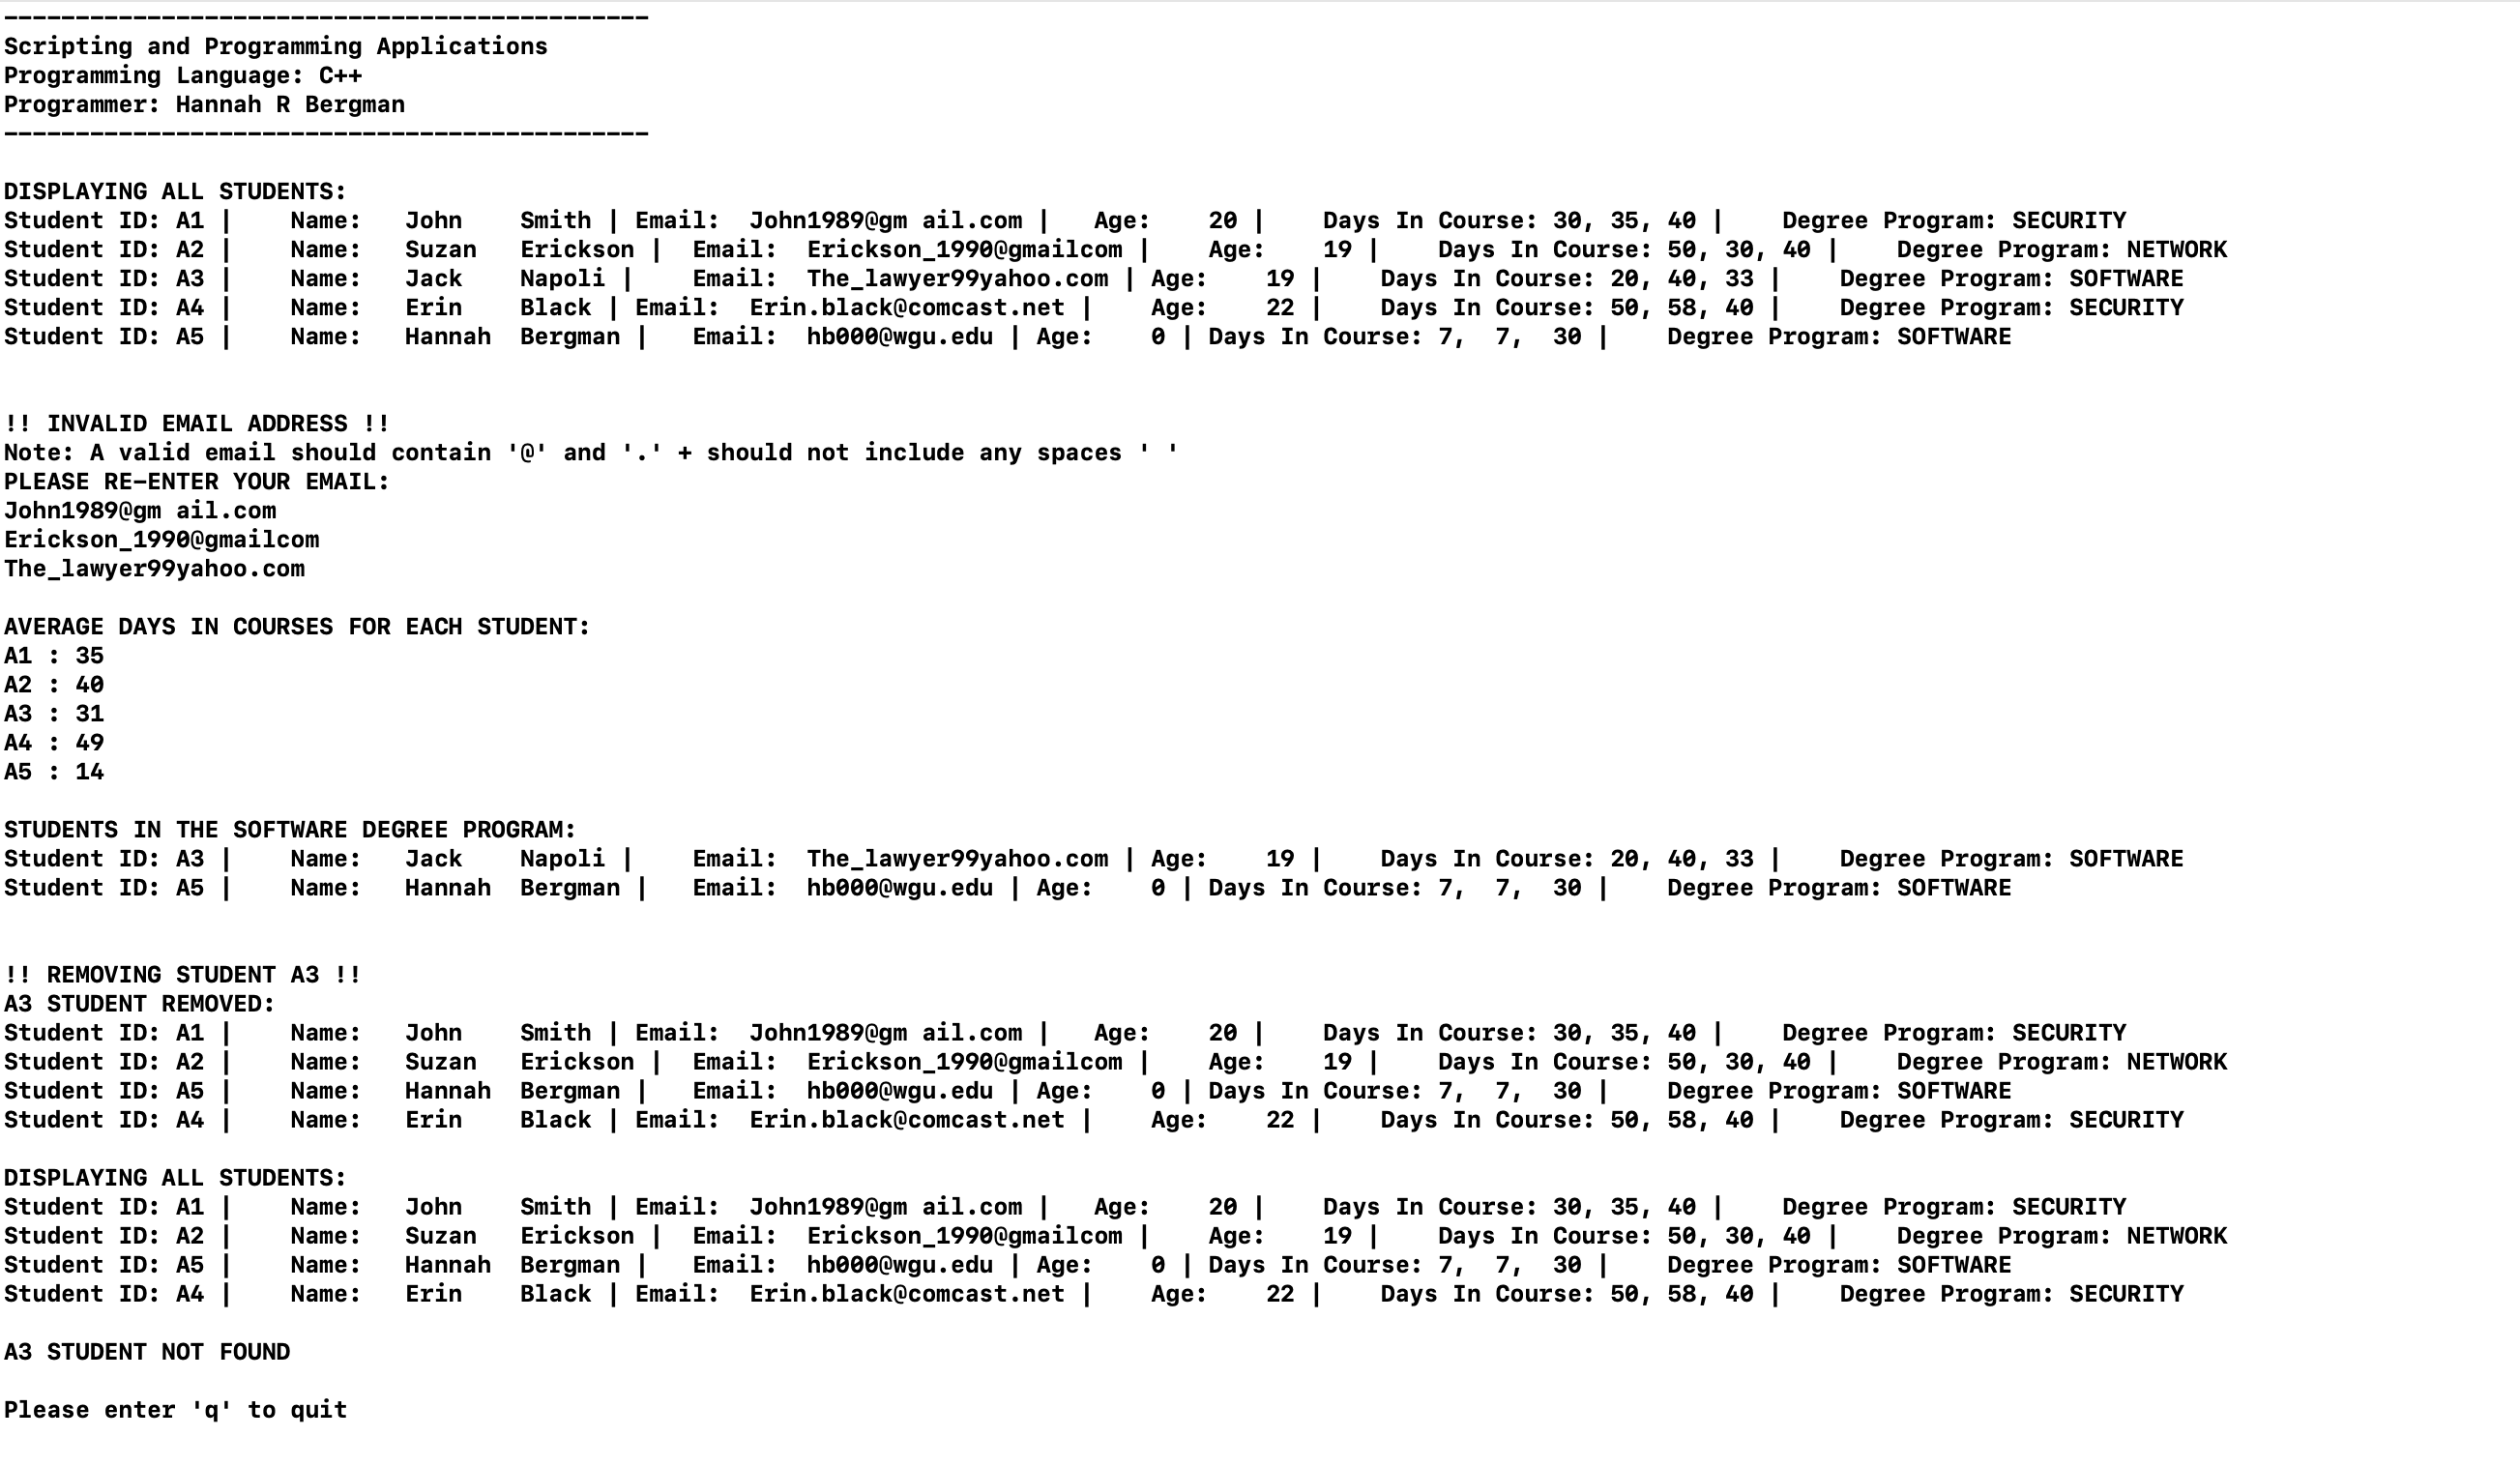
The purpose of this project was to migrate an existing student system to a new platform using C++. I was responsible for implementing the part of the system responsible for reading and manipulating the provided data.
The program contains two classes (Student and Roster). It maintains a current roster of students within a given course. Student data for the program includes student ID, first name, last name, email address, age, an array of the number of days to complete each course, and the student’s degree program. The program reads a list of five students and uses function calls to manipulate data. While parsing the list of data, the program creates student objects. The entire student list is stored in one array of students called classRosterArray.
Tools & Technologies Used
C++
Social Network Clone
My goal for this project is to create a full scale social networking website similar to Facebook/Twitter, with features like news feeds, profiles, friend system, chat system, and trending posts. I’m used to manage social media accounts for business pages when I was more involved with digital marketing so I thought it would be fun to come full circle and challenge myself as a developer to learn the inner workings of such platforms.
I began this project with HTML and PHP to build the registration and login forms, linking those to phpMyAdmin to create a MySQL database to store values (user information like first name, last name, username, email, etc). I configured XAMPP to create a local Apache web server on my computer and utilized the MySQL module for my database.
To style the register and login form, I used vanilla CSS and Bootstrap. jQuery script helped make these forms more responsive so that only one of the forms is viewable to the user at a time (either the login form if they have an account or the registration form if they need to register for a new account).
Tools & Technologies Used
HTML/CSS, Bootstrap, PHP, JavaScript, jQuery, MySQL, phpMyAdmin, XAMPP
Tiger Game
My client, Dyer, Garofalo, Mann, & Schultz (whose company mascot is a tiger), asked if I could create a simple tiger game for them to use as promotional material geared towards a younger crowd. I wasn’t familiar with game development but jumped on the opportunity to give it a go!
I’m building this project with our agency in-house graphic designer, Caitlin. She created the sprite character sheet and background scenes while I’m learning how to use Unity and C# to turn those static files into a working 2D RPG.
This project is still a work in progress so I will have more information about it coming soon!
Tools & Technologies Used
Unity, C#
Client Websites
A small sampling of websites I’ve designed and built, highlighting my ability to work with clients from a wide-range of industries, including:
Real Estate (Property Management), Service (B2B), Legal, Service (B2C), E-Commerce, Non-Profit, and Political (Judicial)

hubermgt.com
Client: Huber Management Corp.
Client Industry: Real Estate

theprgteam.com
Client: Premier Resources Group (PRG)
Client Industry: B2B Service
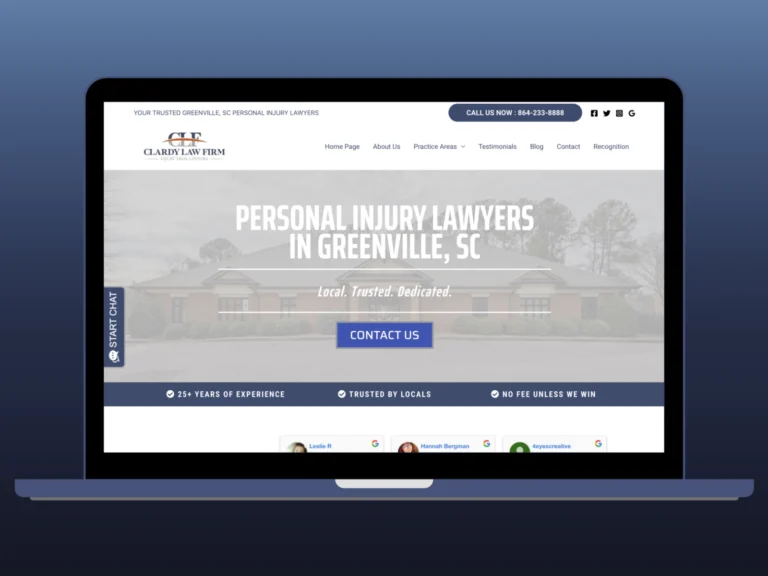
theclardylawfirm.com
Client: The Clardy Law Firm
Client Industry: Legal
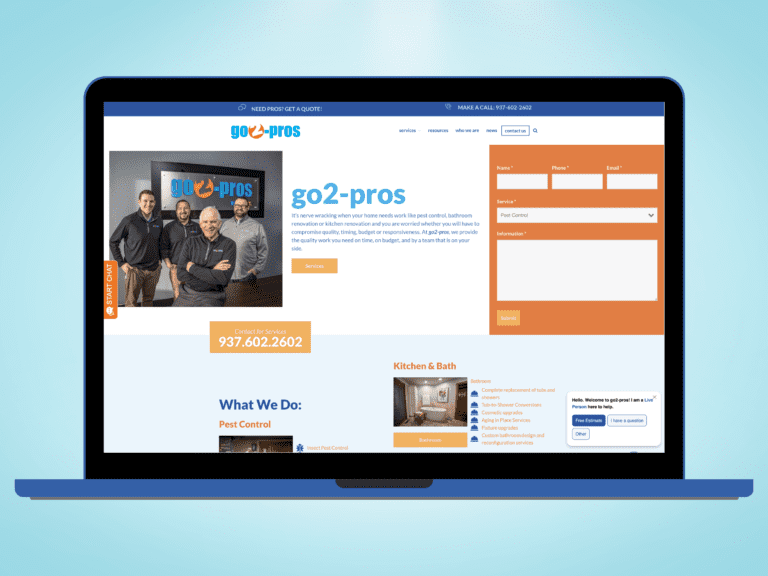
go2-pros.com
Client: Go2-Pros
Client Industry: B2C Service
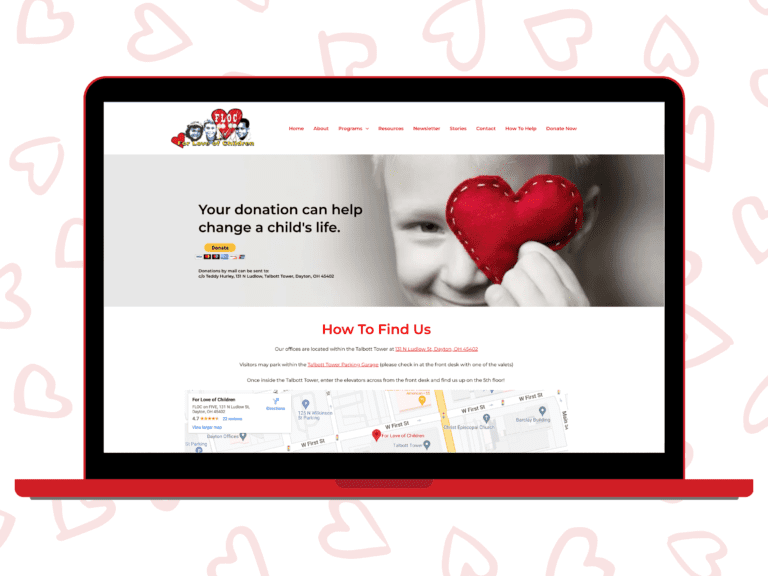
flocdayton.org
Client: For Love of Children (FLOC)
Client Industry: Non-Profit
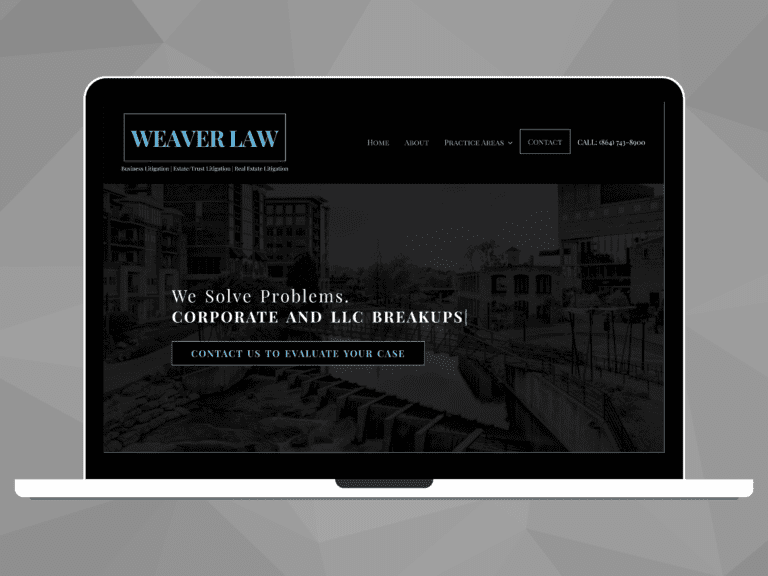
weaverlawsc.com
Client: Weaver Law
Client Industry: Legal
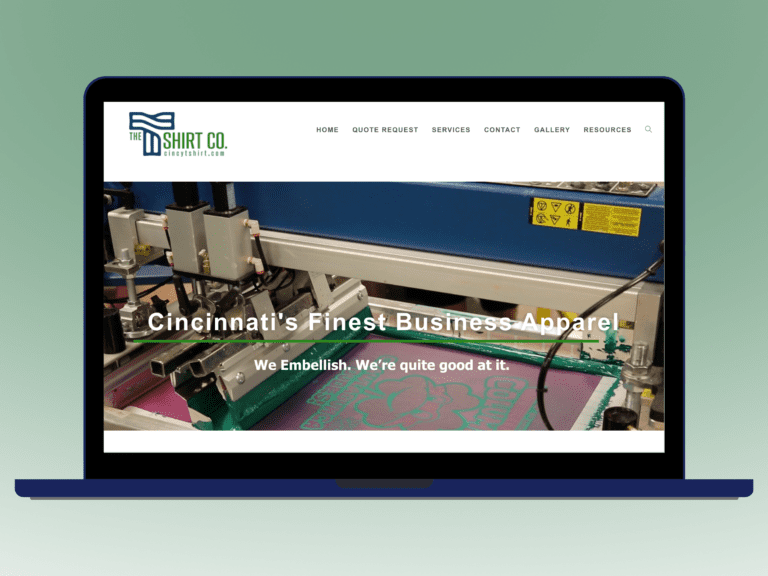
cincytshirts.com
Client: Cincy T-Shirt Co.
Client Industry: E-Commerce
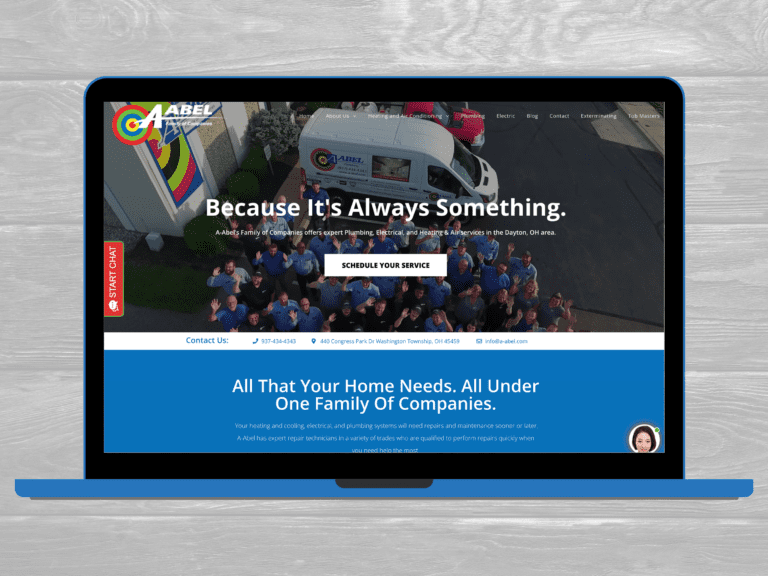
a-abel.com
Client: A-Abel Family of Companies
Client Industry: B2C/B2B Services
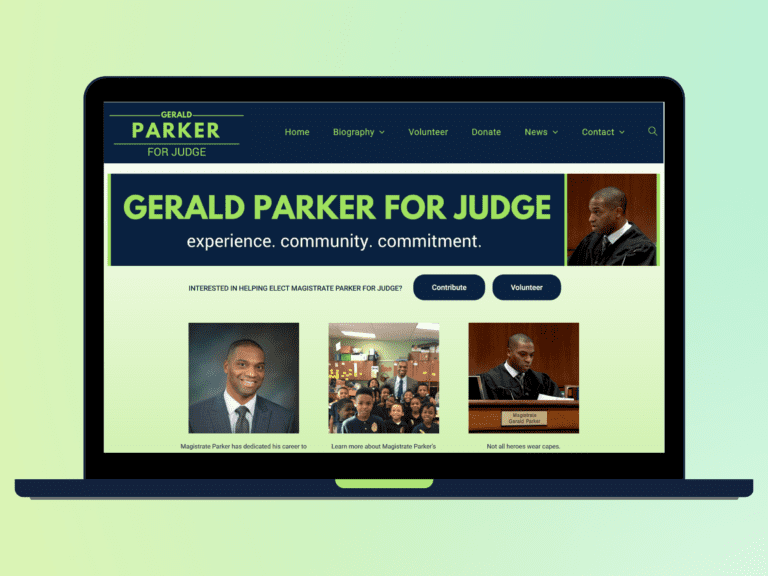
gp4judge.com
Client: Judge G. Parker
Client Industry: Political
Graphic Design
Creativity 🤝 Functionality
Although my primary career aspirations do not focus on graphic design, I wanted to include this section to showcase my creative abilities.
Alongside my diverse skill set, I’m well-versed with digital illustration tools such as Adobe Illustrator, Photoshop, Canva, and Figma, as well as collaborative and creative feedback tools like Slack, Dropbox, Vimeo, and Google Drive.
I include this section to highlight my versatility and further emphasis that when I say I’m a Jill of all trades, I genuinely mean it!

Google Ads Designs
Client: Committee To Elect Magistrate
Arvin Miller for Judge
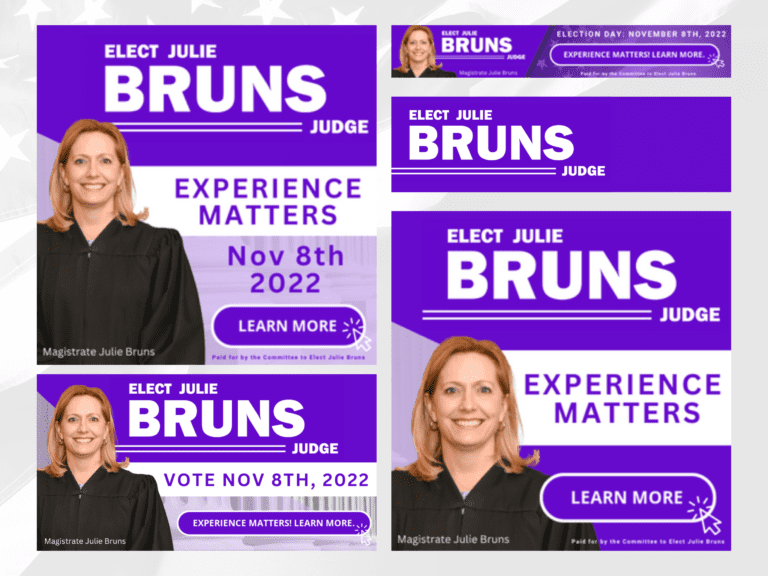
Google Ads Designs
Client: Committee To Elect Julie Bruns

Google Ads Designs
Client: Susan Solle for Judge

Logo Design
Client: Retrofix Games

Logo & Resource Guide Design
Client: CURT (a division of PRG)

Logo Design
Client: PRG